Introduction
Some time ago I started to read about Fourier Transform. I learned about it during my undergraduate but it was a long time ago and I decided to refresh my knowledge. Once I got the concept I started to think if it is possible to use it somehow in cybersecurity or software development in general. I googled and found a few articles and one presentation. The presentation interested me the most and it is titled: Hunting Beacon Activity with Fourier Transforms. I tried to implement the idea by myself so in this post I want to show you the results.
The post is organized as follows. Firstly, I described a problem to solve and an experiment goal. Then I presented an environment I prepared. Finally, I explained the main
part – the Fourier Transform application in an intrusion detection scenario.
Problem and goal
Let’s assume we have malware installed on a machine. We actively use the machine, hence the outgoing communication traffic is huge.
There are many types of malware but I want to narrow it down to the ones that communicate with an adversary or a C&C server. Such communication could be performed periodically, let’s say one health check (outgoing message) per minute to the adversary.
The main goal is to find a suspicious pattern in the outgoing communication logs using Fourier Transform. If the solution finds a pattern, it could be considered a potential tool in an Intrusion Detection System.
Environment
To reproduce to experiment described in the presentation I had to find (or generate) logs that simulate the outgoing communication.
Outgoing communication logs
Fortunately, I found an interesting GitHub repository that redirected me to a suitable log file source – Zenodo. I downloaded SSH.tar.gz logs and parsed them according to my needs. Thanks to that I did not have to generate logs hence randomness is better as the logs come from real systems. Although the logs come from the SSH communication we can treat them in the experiment as outgoing HTTP requests.
I parsed the logs as follows:
- Include only logs with an IP address.
- Take logs from 1 day – 1st of January.
- Create a CSV file with 3 columns: date, ip, and count.
Eventually, my outgoing communication logs looked like this (all the IP addresses come from the original log file and were unchanged by me):

Original logs for comparison:

Malware communication logs
I did not expect to find suspicious activity in the downloaded logs so I added it. This time
I had to generate them according to my own rule that potential malware sends a request every minute. To simulate this behaviour I appended to the previously parsed logs the following ones (start: 00:12:00, end: 23:59:00)

For the sake of the experiment let’s assume that the 1.1.1.1 is an adversary IP address.
Log processing
Having prepared the outgoing communication logs it is time to show visualizations.
Time domain
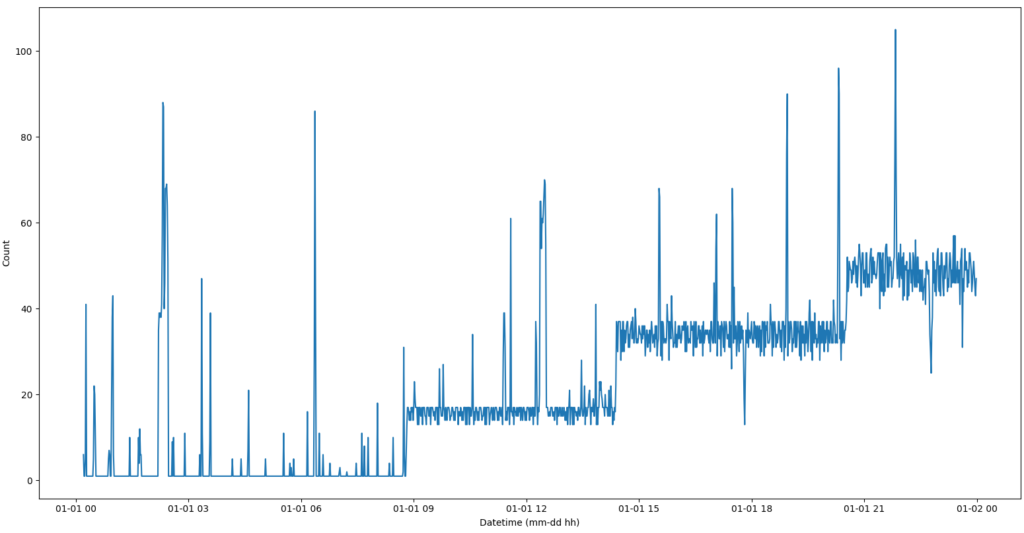
The first idea that comes to my mind is to resample the logs (e.g. 60 seconds intervals) and to generate a time domain plot.

The plot does not show any pattern that might be suggesting periodical malware communication with an adversary. We can see that over the day the number of communication increases and there are some spikes but nothing really special.
Frequency domain
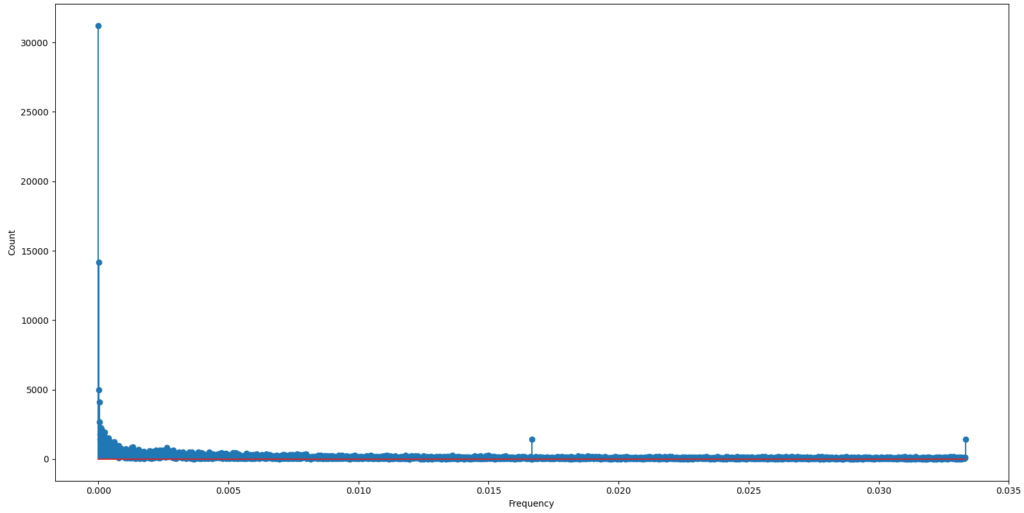
It is time to look at the logs from a slightly different perspective, namely the frequency domain. To get the frequency domain plot I resampled the logs in 15 seconds intervals and applied the Fourier Transform.

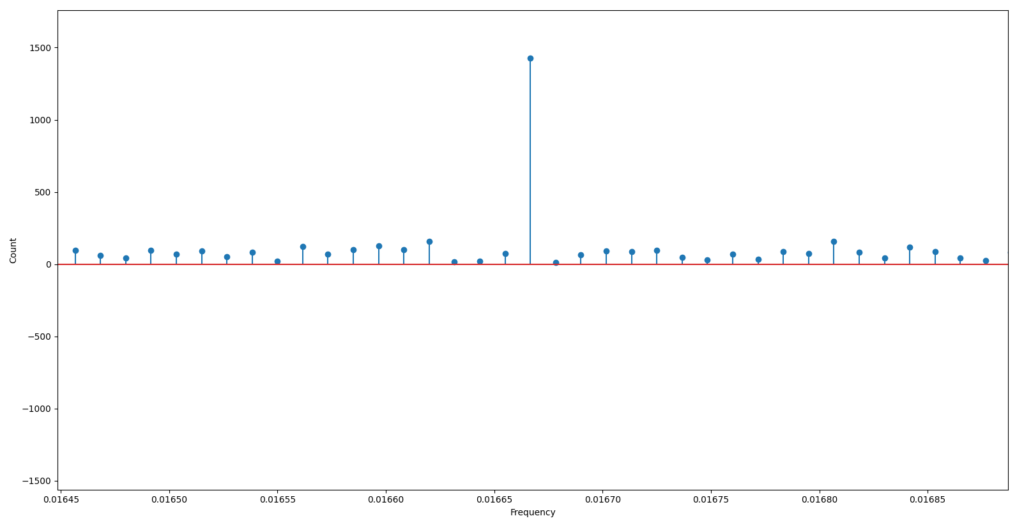
Apart from the spikes at the beginning of the X-axis (which we can ignore), we can observe two interesting spikes between two ranges: (0.015, 0.020) and (0.030, 0.035). Let’s zoom in on the first spike:

We can get the X and Y values: X ~ 0.0167Hz and Y ~ 1400. That is something we should check in detail. If we convert the X value (frequency) to the period according to the equation T = 1/Frequency, then we find out that T ~ 60s – this is the malware outgoing communication period. Moreover, we can see that this frequency has a count ~ 1400. Let’s group IP addresses from our log file and find all in range (1000, 2000):

We found the adversary IP address!
Summary
The reconstruction of the experiment described in Hunting Beacon Activity with Fourier Transforms turns out to be successful as the frequency domain plot points out the malware’s outgoing communication. The idea of using Fourier Transform in this scenario is amazing and it gives a brand new insight into its potential applications in the field of cybersecurity and software development in general.
I used python to implement the experiment and you can get the log file and the python script from my GitHub. To run the program use the command: python .\processLogs.py
Have a nice day, bye!
Be First to Comment